30 Flutter Tips| FT27: Pie Chart and Bar Graph In Flutter
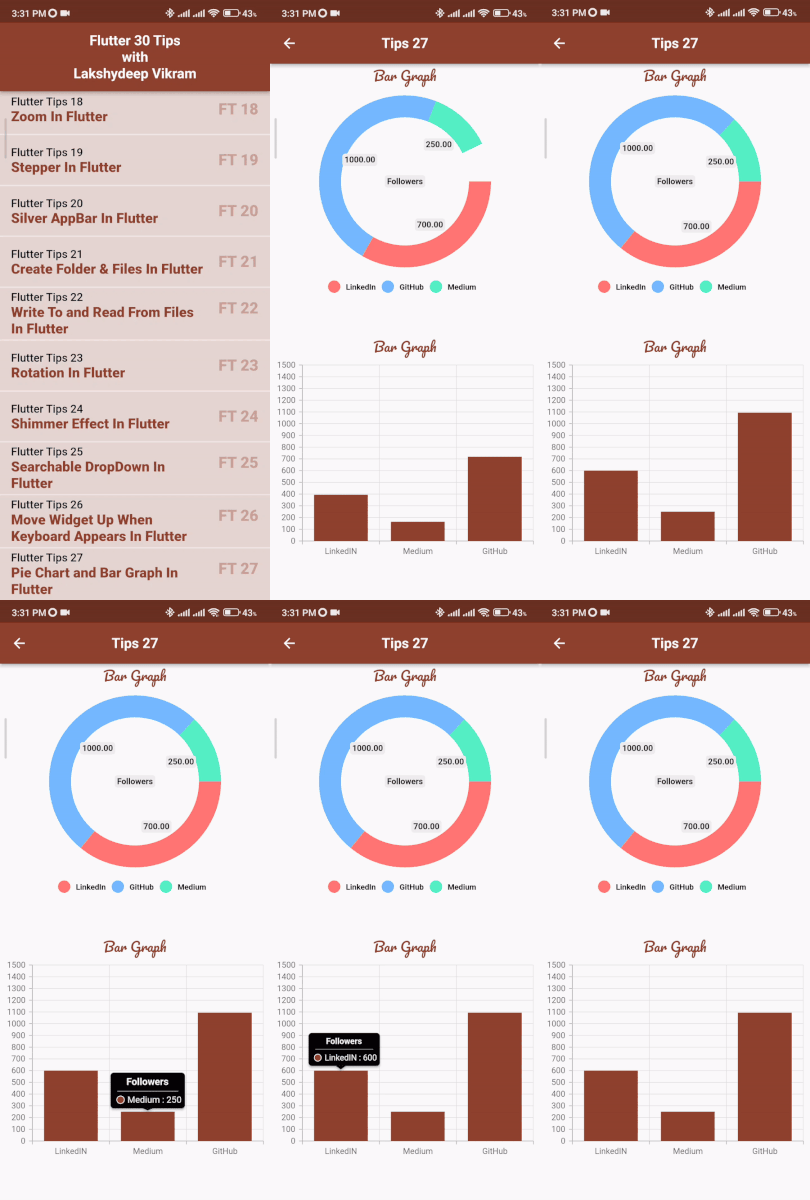
Flutter Tips 27 of #30FlutterTips With LakshydeepVikram series which had explored about using pie chart and bar-graph in Flutter.
You can search for #30FlutterTips for more. If you like this series, please don’t forget to share with #30FlutterTips tag.
FT27: Pie Chart and Bar Graph In Flutter
For Pie chart
Install Package pie_chart:
pie_chart:Use PieChart widget by importing it:
PieChart(
//data types you want to show
    dataMap: const {
      "LinkedIn": 700,
      "GitHub": 1000,
      "Medium": 250,
    },

    animationDuration: const Duration(milliseconds: 800),
    chartLegendSpacing: 32,
//height
    chartRadius: MediaQuery.of(context).size.height * 0.25,

    initialAngleInDegree: 0,
// Types of chart
    chartType: ChartType.ring,

    centerText: "Followers",
    ringStrokeWidth: 32,
// ways to show values
    chartValuesOptions: const ChartValuesOptions(
      showChartValueBackground: true,
      showChartValues: true,
      showChartValuesInPercentage: false,
      showChartValuesOutside: false,
      decimalPlaces: 2,
    ),

//legend options
    legendOptions: const LegendOptions(

// true for horizontal legend and false for vertical legend
      showLegendsInRow: true,

//legend postion
      legendPosition: LegendPosition.bottom,


      showLegends: true,
      legendShape: BoxShape.circle, // BoxShape.rectangle
      legendTextStyle: TextStyle(
        color: Colors.black,
        fontWeight: FontWeight.bold,
      ),
    ),
  );
For Bar graph
Install syncfusion_flutter_charts package:
syncfusion_flutter_charts:Use SfCartesianChart for Bar graph:
TooltipBehavior _tooltip=TooltipBehavior(enable: true);


SfCartesianChart(
//axis yo want to show in x-direction and in y-direction
  primaryXAxis: CategoryAxis(),
  primaryYAxis: NumericAxis(minimum: 0, maximum: 1500, interval: 100),

  tooltipBehavior: _tooltip,
  series: <ChartSeries<_ChartData, String>>[
    ColumnSeries<_ChartData, String>(
// data types
        dataSource: [
          _ChartData("LinkedIN", 600),
          _ChartData("Medium", 250),
          _ChartData("GitHub", 1094)
        ],
        xValueMapper: (_ChartData data, _) => data.x,
        yValueMapper: (_ChartData data, _) => data.y,
        name: 'Followers',
        color: mainColor)
  ]),


class _ChartData {
  _ChartData(this.x, this.y);

  final String x;
  final double y;
}

// for more explore yourself this package
Tips: You can use this package for pie chart as well and may other types of graphical representation.
The whole code had been uploaded here:
GitHub - lakshydeep-14/30FlutterTips: 30 Flutter Tips with Lakshydeep Vikram 30 days in a row.
You can also check YouTube videos and shorts here:
You can buy a book as well:
Make Yourself the Software Developer: Let's Dive Into Flutter & MNCs
Stay Tuned.
Any feedback will be appreciated.
Share with the tag: #30FlutterTips
Let me know some topics you want me to write.
LinkedIN | GitHub | Google DevLibrary | YouTube
Stay in touch for more Flutter tips.
Thanks.


